
After pounding North Carolina and Virginia on Aug. 27, Hurricane Irene made a second landfall near Little Egg Inlet, N.J., early Sunday morning, Aug. 28, still as a category one hurricane with maximum sustained winds of 75 mph (120 kilometers per hour). It then weakened slightly before making a third landfall over Coney Island, N.Y. as a 65-mph (100-kilometer-per-hour) tropical storm. Irene’s heavy rains, winds and storm surge are causing widespread problems throughout the U.S. mid-Atlantic and Northeast.
This infrared image of Irene was taken by the Atmospheric Infrared Sounder (AIRS) instrument on NASA’s Aqua spacecraft at 2:47 a.m. EDT on Aug. 27, a few hours before the storm’s second landfall in New Jersey.
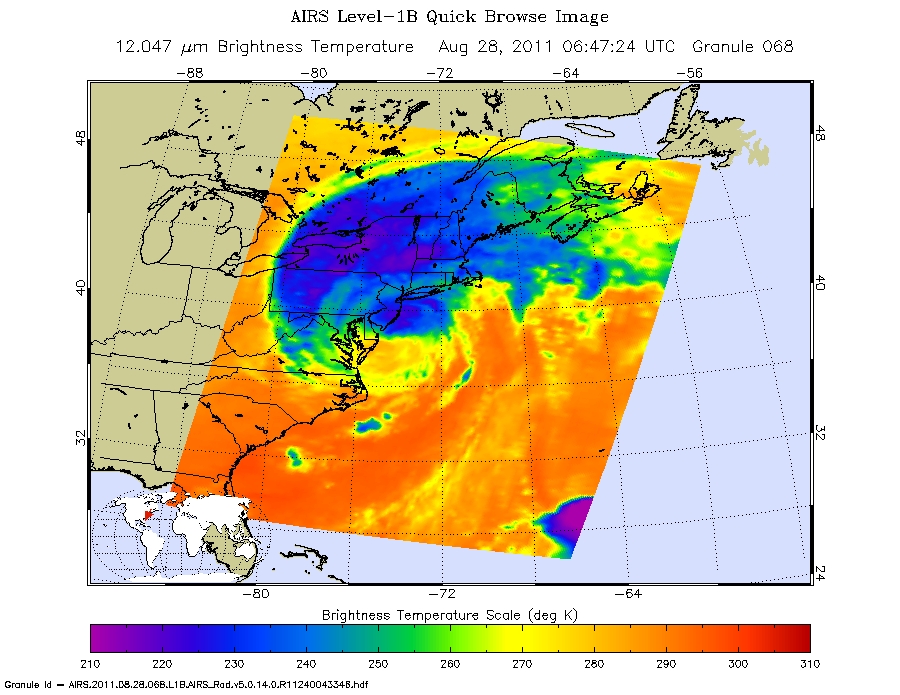
Infrared image of Hurricane Irene from the AIRS instrument on NASA’s Aqua spacecraft, taken at 2:47 a.m. EDT on Aug. 28. The storm’s coldest cloud top temperatures and intense rains are shown in purples and blues. Image credit: NASA/JPL
The AIRS data create an accurate 3-D map of atmospheric temperature, water vapor and clouds, data that are useful to forecasters. The image shows the temperature of Irene’s cloud tops or the surface of Earth in cloud-free regions. The coldest cloud-top temperatures appear in purple, indicating towering cold clouds and heavy precipitation. The infrared signal of AIRS does not penetrate through clouds. Where there are no clouds, AIRS reads the infrared signal from the surface of the ocean waters, revealing warmer temperatures in orange and red.
AIRS is managed by NASA’s Jet Propulsion Laboratory, Pasadena, Calif., under contract to NASA. JPL is a division of the California Institute of Technology in Pasadena.
*Source: NASA/ Jet Propulsion Laboratory