
In a detailed assessment of the Deepwater Horizon oil spill, researchers led by a team from the Woods Hole Oceanographic Institution (WHOI) have determined that the blown-out Macondo well spewed oil at a rate of about 57,000 barrels a day, totaling nearly 5 million barrels of oil released from the well between April 20 and July 15, 2010, when the leak was capped. In addition, the well released some 100 million standard cubic feet per day of natural gas.

3D reconstruction of a hydrocarbon jet leaking from the Deepwater Horizon’s broken riser. Each colored dot represents the location of an acoustic Doppler velocity measurement, with the dot color describing the velocity. The black ellipse indicates the size and location of the jet source; blue dashed ellipses indicate the jet flow perimeter. Black dots indicate the position of the ROV-mounted Doppler sonar during the measurement sequence. (Illustration courtesy of Rich Camilli, Woods Hole Oceanographic Institution)
The results—published in the Sept. 5, 2011 online issue of the Proceedings of the National Academy of Sciences (PNAS)—are in line with the federal government’s official estimates, but just as importantly validate the innovative measuring techniques the team employed. The accuracy of the measurements was crucial because, “Ultimately, the impact of the oil on the environment depends primarily on the total volume of oil released,” according to a report by the Flow Rate Technical Group (FRTG), a collection of research teams charged with using different means to generate an accurate estimate of the amount of oil released into the Gulf.
The new study represents a comprehensive look at the data and findings of the flow rate investigations, focusing on the quality and accuracy of the on-the-fly, under-pressure measurements last summer. “It provides a rigorous assessment of the statistical and systematic uncertainty in our earlier findings,” said WHOI scientist Richard Camilli, lead author of the PNAS paper.
On May 19, 2010, prior to commencing investigation of the Deepwater Horizon leak, Camilli testified to Congress that this proposed acoustic measurement technique would be capable of quantifying the flow rate to within “a factor of two.” The WHOI-led team found just a 17% uncertainty, or error, associated with their estimate.
Added Chris Reddy of WHOI, another co-author of the study, “Considering all they [the WHOI team] had to do in such a short time frame, I’d be quite pleased with any uncertainty rate under 20 percent.”
That low uncertainty rate was due, in large part, to the team’s pioneering measuring techniques, devised primarily by Camilli and WHOI colleague Andrew Bowen. In late May of 2010, the WHOI team installed two acoustic instruments on a remotely operated vehicle called Maxx3. The first was an acoustic Doppler current profiler or ADCP, which measures the Doppler shift in sound, such as the change from the higher pitch of a car as it approaches to a lower pitch as it moves away.
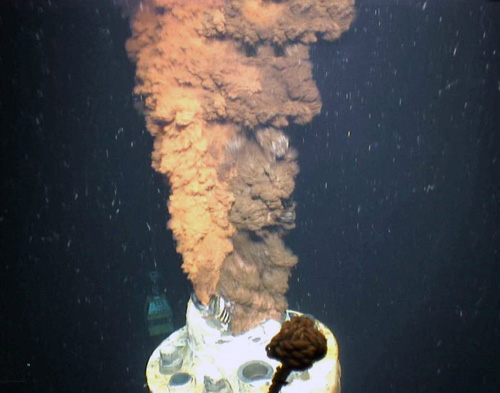
Dark fluids containing oil and natural gas gush out of the broken riser pipe at the Macondo well near the seafloor in the Gulf of Mexico in 2010. Officials needed an accurate measurement of how much oil was flowing out. (Photo courtesy of U.S. Geological Survey)
“We aimed (the ADCP) at the jet of oil and gas that was coming out, and based on the frequency change in the echoes that came back from the jet, we could tell just how fast it was moving,” said Camilli. Within minutes, they obtained more than 85,000 Doppler measurements.
They also used an imaging multibeam-sonar, which operates on the same principles as medical ultrasound. “It gives you the equivalent of black-and-white images of the cross section of the flow of oil and gas,” Camilli said. This enabled the researchers to distinguish oil and gas from seawater, Camilli said.

Lead scientist Richard Camilli is taken by helicopter to Deepwater Horizon site to perform measurements. (Photo by Andy Bowen, Woods Hole Oceanographic Institution)
“By using the acoustic techniques, we were able to collect a tremendous amount of data in the limited time window that was available,” Camilli said. “We were able to see inside of the flow and make measurements of the velocities. With optical systems, you see only the outside. This was sort of like x-ray vision.”
The more than 2,500 sonar images of the jets gave the team a detailed view of the jets’ cross sectional areas. Multiplying these average areas by their average velocities yielded an accurate estimate of the rate of oil and gas released. The method was able to capture the full flow by directly measuring the flow at the well’s leak sources before the fluids could disperse, the FRTG report stated.
While working at the disaster site, Camilli set up a satellite link with a team of researchers throughout the country to meticulously analyze the data. Using computer models of turbulent jet flow, they came up with an estimate of how fast the fluids were flowing out of the pipe.
To collect and analyze the well fluid itself, WHOI used an isobaric gas-tight sampler, or IGT, a deep-sea device developed at WHOI to sample hydrothermal vent fluids. A pristine fluid sample from within the well was crucial to understand what fraction of the flow was oil.

Andy Bowen, director of the National Deep Submergence Facility at WHOI, works with the remotely operated vehicle Maxx3, which carried acoustic sensors to the measure the rate of oil flowing out of the at the blown-out Macondo well drill pipe. (Photo courtesy of Andy Bowen, Woods Hole Oceanographic Institution)
Analysis of the sample showed that, by mass, the Macondo well fluid contained 77 percent oil, 22 percent natural gas, and less than one percent other gases. With data on how much of what was escaping, the scientists could make a preliminary calculation of how much oil was flowing out of the well.
An accurate flow rate gave engineers a clearer picture of what was happening below the surface and a better chance of figuring out how to stem the flow, how much dispersant should be applied to prevent oil from reaching the surface, and to map strategies to regain control of the well, collect the oil, and limit the environmental damage.
Of the nearly 5 million-barrel total of oil released, an estimated 800,000 were recaptured directly from the well by containment measures and never reached the environment, according to the FRTG report.
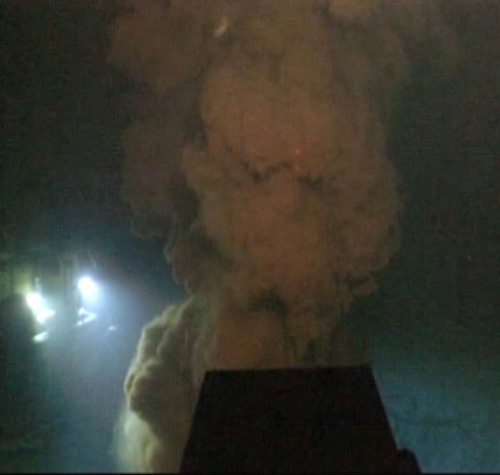
Photograph of a hydrocarbon jet leaking from the Deepwater Horizon’s broken riser (Photo by Rich Camilli, Woods Hole Oceanographic Institution)
Unlike most oil spills in the ocean, which occur at or near the surface, this one was happening nearly a mile deep. It had not been known exactly how petroleum released under the intense pressure and cold temperatures in the depths would behave chemically or physically, but many suspected that not all of it would make it to the surface. “No proven techniques existed for estimating the flow under such conditions,” said an FRTG report dated March 11, 2011.
“Over the past decade ultra deepwater oil platforms have gone from non-existent to representing about 1/3 of the Gulf of Mexico’s oil production and plans call for a growing number of such facilities,” Camilli said. “Society benefits when industry, government, and academia work cooperatively to improve assessment and intervention capabilities” in that setting. The new study confirms “a new tool in the repertoire” to monitor ultra deepwater facilities, he added.
Reddy concurred. “If there is any silver lining” to the Deepwater Horizon spill, he said, “it’s that the techniques and equipment developed and used by [Camilli and Bowen] could be used in the future” to help monitor and control any problems with deep-water oil facilities.
Other WHOI members of the research team include Dana R. Yoerger, Jeffrey S. Seewald, Sean P. Silva, Judith Fenwick and Louis L. Whitcomb (also of Johns Hopkins University); along with Daniela Di Iorio of the University of Georgia, and Alexandra H. Techet of MIT.
The study was funded by the U.S. Coast Guard with additional support from a National Science Foundation RAPID grant and the WHOI Coastal Ocean Institute.
*Source: Woods Hole Oceanographic Institution