
For the first time, all of Iceland’s glaciers are shown on a single map, produced by the Icelandic Meteorological Office (IMO), in collaboration with the U. S. Geological Survey (USGS) and Iceland Geosurvey. The map is the first to incorporate historical data and coverage from aerial photographs and remote sensing satellites, such as Landsat and SPOT, to show the change in the areal extent of glaciers during the past century.
Iceland has about 300 glaciers throughout the country, and altogether, 269 glaciers, outlet glaciers and internal ice caps are named. The glaciers that lack names are small and largely newly revealed, exposed by melting of snow pack due to warmer summer temperatures. The number of identified glaciers has nearly doubled at the beginning of the 21st century.
“Iceland’s glaciers have also been revealed to be quite dynamic during the past century,” said Oddur Sigurðsson, the senior author of the new map and a glaciologist with the IMO. “At the maximum of the Little Ice Age (about 1890 in Iceland), it’s glaciers reached their greatest areal extent before receding to their present-day positions, interrupted with a few cooler periods during this century-long recession. Iceland’s glaciers continue their retreat and lose volume; its ice caps are losing an average of 1 m of ice each year from their surfaces.”
Subglacier volcanic calderas and their locations with respect to the glaciers are an important feature of the new map. Many of Iceland‘s glaciers lie over active volcanoes, including Eyjafjallajökull, the now well-known volcano an eruption from which in 2010 disrupted air travel between North America and Europe and within Europe.
Knowing which volcanic calderas lie beneath glaciers and their history of volcanic activity is important for disaster preparation and mitigation. When a volcano erupts beneath a glacier, it often results in the unleashing of very large volume floods known by scientists as a jökulhlaup (“Glacier-outburst flood”).
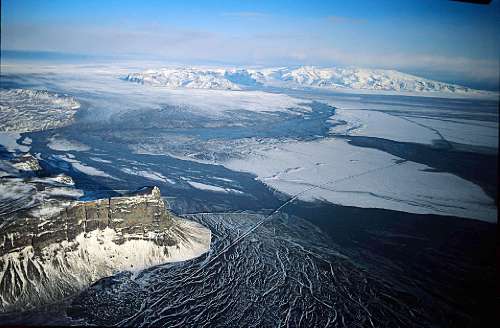
Photograph of the large jökulhlaup that spread out across Skeiðarársandur (glacial outwash plain) from the terminus of Skeiðarárjökull, an outlet glacier of Vatnajökull. The Skeiðarárhlaup was from the accumulation of glacial meltwater in the Grímsvötn caldera from the Gjálp eruption in late September/early October 1996 in northwestern Vatnajökull (eastern flank of the Bárðarbunga subglacier caldera), although the jökulhlaup did not take place until several weeks later, on 5 November 1996. The photograph was probably taken on 5 November 1996, but Oddur could confirm the exact date he took the photograph. The broad lobe of the terminus of the Skeiðarárjökull outlet glacier can be seen in the left background and Iceland´s tallest mountain, Öræfajökull in the right background. Breeches in the road across Skeiðarársandur can be seen, especially the removal of the bridge over the Gígjukvísl glacier river, but the bridge in the foreground over the glacier river Núpsvötn is still intact, probably because the peak flow was 2,300 cu. m. per sec there, 33,000 cu. m. per sec. at Gígjukvísl, and 22,000 cu. m. per sec. at Skeiðará, the bridge over which was also carried away. The photo of Skeiðarársandur was made on 6 Nov. 1996. Image credit: Oddur Sigurðsson , Iceland Meteorological Office
This volcano-glaciological hazard is well known to Icelanders. The largest jökluhlaups occur when the Katla volcano under the Mýrdalsjökull ice cap (just to the east of Eyjafjallajökull; see graphic, an excerpt from the map) erupts, resulting in a flood that exceeds the normal flow of the Amazon River, Earth’s largest river in terms of volume of water!
Richie Williams, emeritus senior research geologist with the USGS and collaborator on the map notes that, “The more than 40 years of scientific research in Iceland by USGS scientists, in collaboration with numerous Icelandic scientists and institutions, has produced many important scientific publications in volcanology, geothermal activity, volcanic geomorphology, glaciology, and geologic hazards.”
Surge-type glaciers also make their debut on this cartographically unique map. Surge-type glaciers are those that, for reasons not completely understood scientifically, suddenly move forward, advancing several hundred meters or even several kilometers in a few months.
Brúarjökull, a surge-type glacier on the northern margin of Vatnajökull, Iceland’s largest ice cap, surged forward 8 km in 1963/1964. Eyjabakkajökull, a surge-type glacier just to the east of Brúarjökull, surged about 2 km in 1972/1973, a change that was captured on the first Landsat images acquired of a surging glacier.
The map of Iceland’s glaciers is the result of many decades of research and data collection from all across Iceland, the area of which is about the same as the Commonwealth of Virginia. Maps compiled by the Danish Geodetic Survey in the first third of the 20th century, aerial mapping missions for the U.S. Army Map Service at the end of World War II, satellite images from Landsat and SPOT during a period of four decades, all contributed to the map´s compilation.
The USGS and many Icelandic scientific institutions, including the Icelandic Meteorological Office, have a more than 40-year history of cooperative research, including a long-standing Memorandum of Understanding for research on a wide variety of subjects, including glaciers, volcanoes, tectonics, and geothermal energy. Iceland is the world leader in geothermal exploration and technology, a major source of “green” energy.
The map is entitled “Map of the Glaciers of Iceland” (“Jöklakort af Íslandi” in Icelandic); the map Legend is in both Icelandic and English and is available from the Icelandic Meteorological Office or Iðnú ehf. More information on glacier research in the USGS can be found online.
*Source: U.S. Geological Survey