
USGS Website Lets You See
For the first time, maps and summaries of historical and projected temperature and precipitation changes for the 21st century for the continental U.S. are accessible at a county-by-county level on a website developed by the U.S. Geological Survey in collaboration with the College of Earth, Oceanic and Atmospheric Sciences at Oregon State University.
The maps and summaries are based on NASA downscaling of the 33 climate models used in the 5th Climate Model Intercomparison Project and the current Intergovernmental Panel on Climate Change (IPCC) Assessment Report. The resulting NASA dataset is on an 800-meter grid with national coverage.
The USGS leveraged this massive dataset and distilled the information into easily understood maps, 3-page summaries and spreadsheet compatible data files for each state and county in the United States. A similar implementation for the USGS nested hydrologic units will be available in the next month.
“This product is innovative, user-friendly and invaluable for assessing and understanding climate model simulations of local and regional climate and climate change whether you’re a policy maker, a manager, a planner, an educator or another engaged U.S. citizen,” said Matthew Larsen, associate director for the USGS Climate and Land Use Program. “The maps and summaries at the county level condense a huge volume of data into formats that are informative for planning, teaching, adaptation and mitigation purposes.”
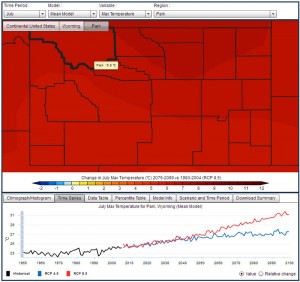
Example of the web application displaying changes in maximum summer (July) temperature for Park County, WY (home of Yellowstone National Park). The time-series chart below the map displays two emission scenarios: RCP8.5 (“business as usual”) and RCP 4.5 (“greenhouse gas reduction/remediation”) from 1950-2100. By the end of the century, the maximum temperature in Park County is projected to warm by 7.5 °C (13.5 °F) under the RCP 8.5 (business as usual) scenario and 3.9 °C (7.0 °F) under RCP 4.5 (greenhouse gas reduction/remediation). Image credit: U.S. Geological Survey (Click image to enlarge)
USGS scientists Jay Alder and Steve Hostetler, who designed and implemented the project as part of their other efforts at visualizing climate models, noted that users can not only view the county average of all the 30 climate models, but they can also select individual models to see how they compare or differ.
To make the number of permutations more manageable for the viewer, Alder and Hostetler averaged the data for the historical period and two future IPCC climate scenarios into 25-year periods (1980-2004, 2025-2049, 2050-2074 and 2075-2099) that span the 21st century. Absolute values and changes in temperature and precipitation for these periods are accessible through the viewer. Other useful tools for characterizing climate change include plots of monthly averages of temperature and precipitation, time-series spanning 1950-2099, and tables that summarize possible changes in the extremes of temperature and precipitation.
“We believe that this product will be useful for a variety of purposes,” Alder said. “For example,” he said, “farmers and land managers can use the information to help them think about adaptation and mitigation strategies, or educators can use it to teach students about aspects of climate model simulations that underpin IPCC Assessment Reports.”
The maps and summaries are available here.
More information about USGS Climate and Land-Use Research is available here.
*Source: U.S. Geological Survey