
If we had a second Earth, we could experiment with its atmosphere to see how increased levels of greenhouse gases would change it, without the risks that come with performing such an experiment. Since we don’t, scientists use global climate models.
In the virtual Earths of the models, interlocking mathematical equations take the place of our planet’s atmosphere, water, land and ice. Supercomputers do the math that keeps these virtual worlds turning — as many as 100 billion calculations for one modeled year in a typical experiment. Groups that project the future of our planet use input from about 30 such climate models, run by governments and organizations worldwide.
When these models calculate the potential climate impacts of the real-life experiment we are conducting by emitting more greenhouse gases into the atmosphere, they all agree that Earth will be warmer 50 years from now. They don’t agree on how much warmer.
For a convenient global-change benchmark, climate scientists use “doubled CO2,” meaning twice as much carbon dioxide in the atmosphere as before the Industrial Revolution, when humans started adding large amounts of the greenhouse gas to the air. The undisturbed level was about 280 parts per million (that is, 280 molecules of carbon dioxide in every million molecules of air), and today’s level is around 400 parts per million. We could reach the doubled-CO2 benchmark as soon as 50 or 60 years from now.
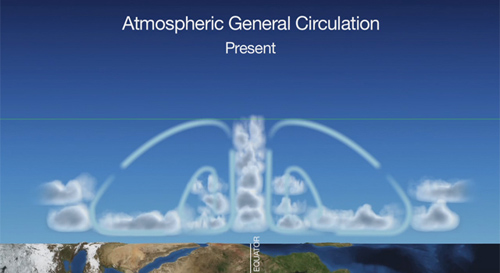
Atmospheric general circulation is expected to change as a result of increasing greenhouse gases. The rising air flow near the equator will grow stronger, lofting air higher into the atmosphere. Mid-latitude clouds will become sparser than is shown here, and these regions will be hotter and drier. Image credit: NASA/GSFC/SVS
The highest and lowest forecasts of average global temperature when we reach the doubled-CO2 benchmark differ by 5.4 degrees Fahrenheit (3 degrees Celsius). That’s greater than the difference between the average global temperature during the last ice age and today. Despite increases in model complexity and sophistication in recent decades, that 5.4-degree range of uncertainty has shrunk very little.
Modelers have known for decades that clouds are the largest source of the uncertainty. But almost every process in the atmosphere affects clouds. It hasn’t been clear which processes are driving cloud changes as the climate warms.
A new NASA-led study suggests that the processes most closely related to the cloud changes are connected with the global pattern of air movements called the atmospheric general circulation. The study also finds that the models with the most realistic representation of the general circulation are those that produce warmer forecasts of the time when we reach the doubled-CO2 benchmark.
Hui Su of NASA’s Jet Propulsion Laboratory, Pasadena, California, and colleagues recently evaluated 15 of the world’s leading global climate models, evaluating links among atmospheric processes, modeled clouds and probable forecast accuracy. “People have been searching for the culprit for these model differences for a long time,” said Su. “Our research suggests that how models handle atmospheric circulation in a warming climate is directly linked to how clouds will change — and therefore linked to how much warmer the climate will be.” A paper on the research is published online May 21 in the Journal of Geophysical Research.
Scientists expect to see a complicated pattern of changes in the general circulation as the climate warms — prevailing winds are likely to weaken in some areas and strengthen in others, zones of ascending winds will migrate closer to the equator, and descending winds will move closer to the poles, etc. (see illustration).
Su and her research team from JPL; the California Institute of Technology, Pasadena; and UCLA found dramatic variations in the way in which the models simulated these changes. The differences set off a chain of consequences: different environmental conditions within each model led it to produce different forms of clouds, which finally led to a different overall response to greenhouse warming.
The atmosphere’s general circulation can’t be observed directly from space, so the scientists used satellite observations of clouds and relative humidity as a stand-in for general circulation. They compared the models’ simulations of clouds and relative humidity over the last decade with observations from four NASA spaceborne instruments: the CloudSat satellite, Cloud Aerosol Lidar and Infrared Pathfinder Satellite Observations (CALIPSO), the Atmospheric Infrared Sounder (AIRS) instrument on NASA’s Aqua spacecraft and the Microwave Limb Sounder instrument on NASA’s Aura spacecraft.
Five of the climate models tested closely reproduced the clouds and relative humidity observed by the satellites. These same five models all have greater changes in atmospheric circulation than the other models. The circulation changes decrease the cooling effect of clouds in the future.
The five models predict a relatively warmer future climate than the other 10 models. They forecast that global surface temperatures will rise by 6.5 to 8.5 degrees Fahrenheit (3.6 to 4.7 degrees Celsius) when atmospheric carbon dioxide has doubled from its pre-industrial level. That’s in the top one-third of the range of all 15 forecasts.
“We’ve used NASA satellite observations to narrow the range of the climate projections. Based on the observations, we’ve seen that the models that best represent these observations are at the higher end of the modeled warming. We hope these results, and those of other consistent studies recently published, will have value to policy makers who are responding to this global threat,” said Su.
For more information about the satellites used in the study, visit:
https://www-calipso.larc.nasa.gov/
https://cloudsat.atmos.colostate.edu/
NASA monitors Earth’s vital signs from land, air and space with a fleet of satellites and ambitious airborne and ground-based observation campaigns. NASA develops new ways to observe and study Earth’s interconnected natural systems with long-term data records and computer analysis tools to better see how our planet is changing. The agency shares this unique knowledge with the global community and works with institutions in the United States and around the world that contribute to understanding and protecting our home planet.
For more information about NASA’s Earth science activities in 2014, visit:
https://www.nasa.gov/earthrightnow
– Written by Carol Rasmussen
*Source: NASA/Jet Propulsion Laboratory