
A NASA-sponsored expedition is set to sail to the North Atlantic’s saltiest spot to get a detailed, 3-D picture of how salt content fluctuates in the ocean’s upper layers and how these variations are related to shifts in rainfall patterns around the planet.
The research voyage is part of a multi-year mission, dubbed the Salinity Processes in the Upper Ocean Regional Study (SPURS), which will deploy multiple instruments in different regions of the ocean. The new data also will help calibrate the salinity measurements NASA’s Aquarius instrument has been collecting from space since August 2011.
SPURS scientists aboard the research vessel Knorr leave Sept. 6 from the Woods Hole Oceanographic Institution in Woods Hole, Mass., and head toward a spot known as the Atlantic surface salinity maximum, located halfway between the Bahamas and the western coast of North Africa. The expedition also is supported by the National Oceanic and Atmospheric Administration and the National Science Foundation.
The researchers will spend about three weeks on site deploying instruments and taking salinity, temperature and other measurements, before sailing to the Azores to complete the voyage on Oct. 9.
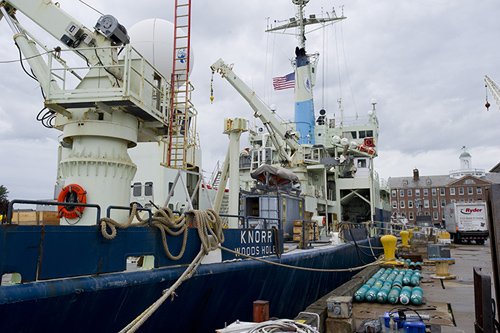
The R/V Knorr at the WHOI dock in Woods Hole, Mass., is readied for the SPURS expedition to the “salinity maximum zone” of the North Atlantic. During the four-and-one-half week cruise, scientists will deploy an array of instruments designed to detect how salinity fluctuates in the upper ocean and how the variations are related to shifts in global rainfall patterns. Image credit: Tom Kleindinst, Woods Hole Oceanographic Institution
They will return with new data to aid in understanding one of the most worrisome effects of climate change — the acceleration of Earth’s water cycle. As global temperatures go up, evaporation increases, altering the frequency, strength, and distribution of rainfall around the planet, with far-reaching implications for life on Earth.
“What if the drought in the U.S. Midwest became permanent? To understand whether that could happen we must understand the water cycle and how it will change as the climate continues to warm,” said Raymond Schmitt, a physical oceanographer at Woods Hole and principal investigator for SPURS. “Getting that right is going to involve understanding the ocean, because the ocean is the source of most of the water.”
Oceanographers believe the ocean retains a better record of changes in precipitation than land, and translates these changes into variations in the salt concentration of its surface waters. Scientists studying the salinity records of the past 50 years say they already see the footprint of an increase in the speed of the water cycle. The places in the ocean where evaporation has increased and rain has become scarcer have turned saltier over time, while the spots that now receive more rain have become fresher. This acceleration ultimately may exacerbate droughts and floods around the planet. Some climate models, however, predict less dramatic changes in the global water cycle.

Expedition chief scientist, Ray Schmitt (left), a WHOI physical oceanographer, oversees pre-cruise activities on the WHOI dock with NASA physical oceanography program scientist Eric Lindstrom. Image credit: Tom Kleindinst, Woods Hole Oceanographic Institution
“With SPURS we hope to find out why these climate models do not track our observations of changing salinities,” said Eric Lindstrom, physical oceanography program scientist at NASA Headquarters in Washington. “We will investigate to what extent the observed salinity trends are a signature of a change in evaporation and precipitation over the ocean versus the ocean’s own processes, such as the mixing of salty surface waters with deeper and fresher waters or the sideways transport of salt.”
To learn more about what drives salinity, the SPURS researchers will deploy an array of instruments and platforms, including autonomous gliders, sensor-laden buoys and unmanned underwater vehicles. Some will be collected before the research vessel heads to the Azores, but others will remain in place for a year or more, providing scientists with data on seasonal variations of salinity.
Some of the devices used during SPURS to explore the Atlantic’s saltiest spot will focus on the outer edges of the study area, traveling for hundreds of miles and studying the broadest salinity features. Other instruments will explore smaller areas nested inside the research site, focusing on smaller fluxes of salt in the waters. The suite of ocean instruments will complement data from NASA’s salinity-sensing instrument aboard the Aquarius/SAC-D (Satelite de Aplicaciones Cientificas-D) observatory, and be integrated into real-time computer models that will help guide researchers to the most interesting phenomena in the cruise area.
“We’ll be able to look at lots of different scales of salinity variability in the ocean, some of which can be seen from space, from a sensor like Aquarius,” said David Fratantoni, a physical oceanographer with Woods Hole and a member of the SPURS expedition. “But we’re also trying to see variations in the ocean that can’t be resolved by current satellite technology.”
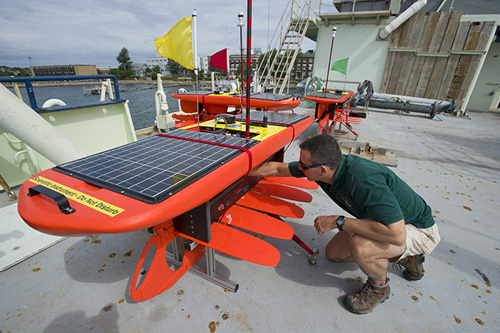
WHOI physical oceanographer Dave Fratantoni inspects one of several “wave gliders” on the deck of R/V Knorr. The wave glider uses wave motion to propel itself through the ocean and solar-charged batteries to power its data collection sensors. Equipped to measure temperature, salinity, and meteorological conditions, wave gliders will occupy a 62-mi (100-km) region near the SPURS moored array for a year. Image credit: Tom Kleindinst, Woods Hole Oceanographic Institution
The 2012 SPURS measurements in the North Atlantic will help scientists understand the behavior of other high-salinity regions around the world. A second SPURS expedition in 2015 will investigate low-salinity regions where there is a high input of fresh water, such as the mouth of a large river or the rainy belts near the equator.
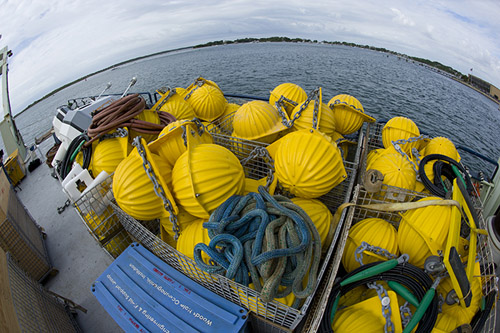
Mooring lines will be instrumented with a range of data loggers at various ocean depths. Flotation balls in yellow hard hats will be strung down the mooring lines to keep the weighted line afloat and tangle free. Image credit: Tom Kleindinst, Woods Hole Oceanographic Institution
*Source: Woods Hole Oceanographic Institution (WHOI)