
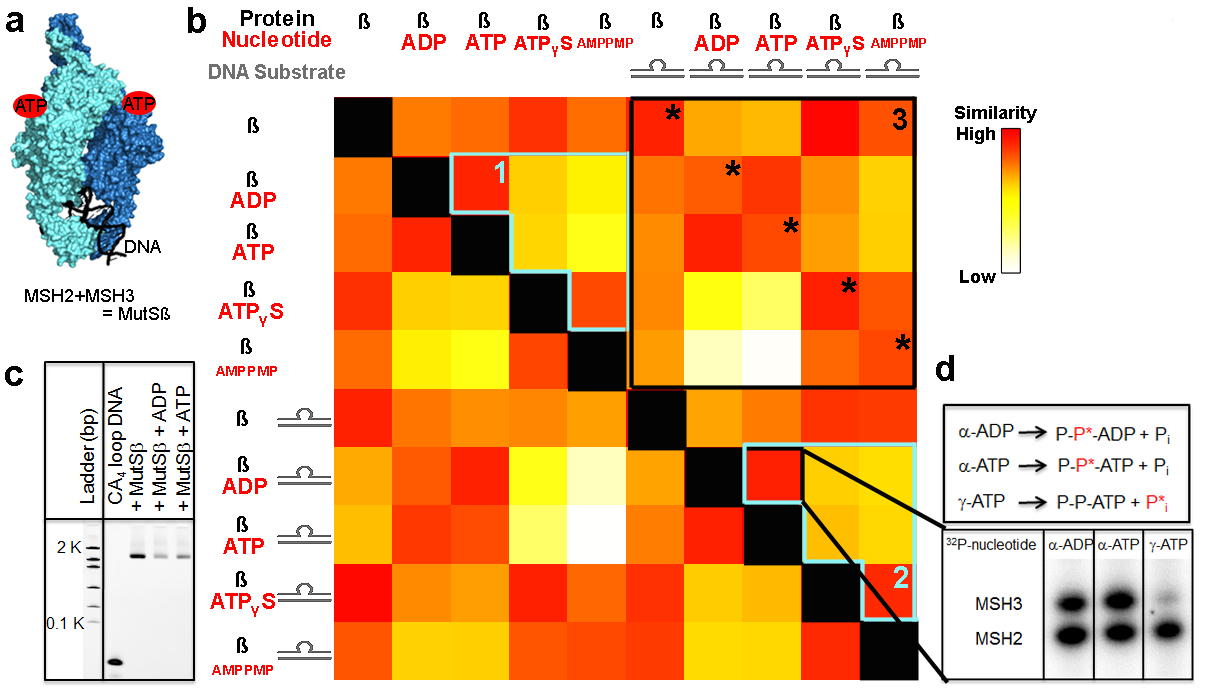
Data in this revolutionary structural comparison map is presented as a color-coded checkerboard with similarity scores displayed as gradients moving from red, indicating high, to white, indicating low, and various shades of orange and yellow in between. Image credit: Berkeley Lab (Click image to enlarge)
(Visited 27 times, 1 visits today)