
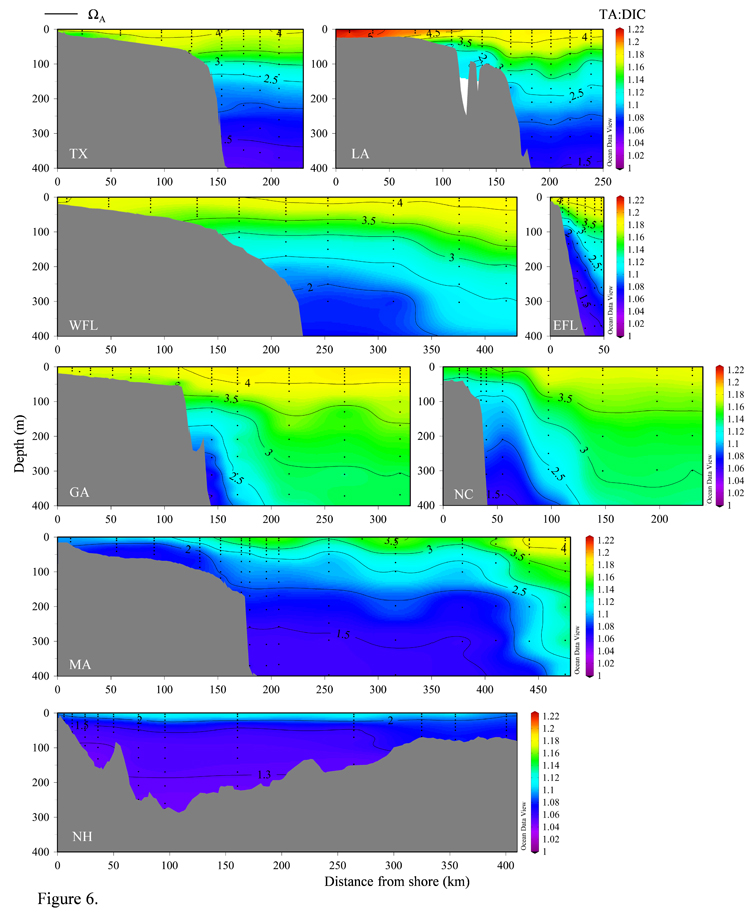
By collecting and analyzing water samples, Wang and his colleagues charted the coastal ocean’s capacity to buffer itself from increase input of CO2 or resist a change in pH (shown as a ratio of total alkalinity, TA, to dissolved inorganic carbon, DIC). The dark blue color indicates a low capacity; red indicates a higher capacity. The waters in the Gulf of Mexico are more resistant to change; the waters off New Hampshire and Massachusetts are less resistant. In the figure, the contour lines labeled with numbers represent the calcium carbonate saturation state of aragonite, a mineral form of calcium carbonate. The higher numbers mean shell-building organisms have more carbonate with which to produce their shells than areas with lower numbers, where less carbonate is available for shell building. Shells will dissolve in waters with a saturation state value below 1, but organisms will feel the effect of low saturation state before it reaches 1. (Image courtesy of Wang, et al., 2013) (Click image to enlarge)