But before we proceed, let's make it clear what are these two deviations. The terms make you little bit confused. So let's get it clear first.
Standard deviation is a measure of how widely your data points are dispersed or far away from the mean (from the average value).
A low standard deviation means that the data points are close to the mean, while a high standard deviation indicates that the data points are spread apart (over a wider range) from the mean.
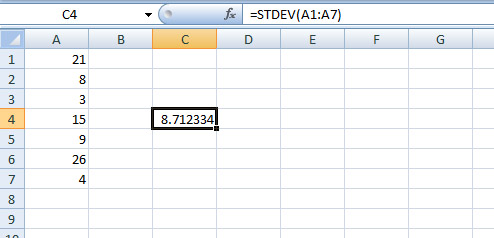
Microsoft Excels's STDEVA function estimates standard deviation based on a sample.
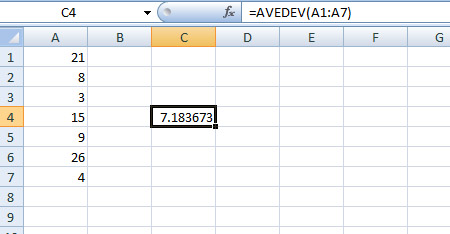
On the other hand, AVEDEV function returns you the average of the absolute deviations of your data points from their mean. That menas,
it first calculates the absolute deviation of each data point from the mean, then
calculates the mean or average value of the deviation.
So how it will be for the above example:
Mean = (21 + 8 + 3 + 15 + 9 + 26 + 4)/7 = 12.28571
Now calculate absolute deviation of each data point from the mean. Remember, it's absolute deviation, so you ignore the minus sign.
so,
|21 – 12.28571| = 8.714286
|8 – 12.28571| = 4.285714
|3 – 12.28571| = 9.285714
|15 – 12.28571| = 2.714286
|9 – 12.28571| = 3.285714
|26 – 12.28571| = 13.714286
|4 – 12.28571| = 8.285714
Now, sum of absolute deviations = (8.714286 + 4.285714 + 9.285714 + 2.714286 + 3.285714 + 13.714286 + 8.285714) = 50.285714
So the mean of absolute deviation = 50.285714/7 = 7.183673
Clear!!