A cumulative sum is the summation of numbers in a given sequence.
For example, the cumulative sum of the sequence {1,2,3,4,5....} is 1, 3 (1+2), 6 (1+2+3), 10 (1+2+3+4), 15 (1+2+3+4+5)....... and so on.
That means everytime you add a new number to your sequence, it is added to the previous total and makes a new total. It's a dynamic summation, you can say. That's it. No mysterie-hysterie here
So let's look at the example below: You want to calculate the cumulative sum of your working hours for the first twenty days of January 2016. However you have data for the first ten days, the rest you will add accordingly. So how it's going to be?
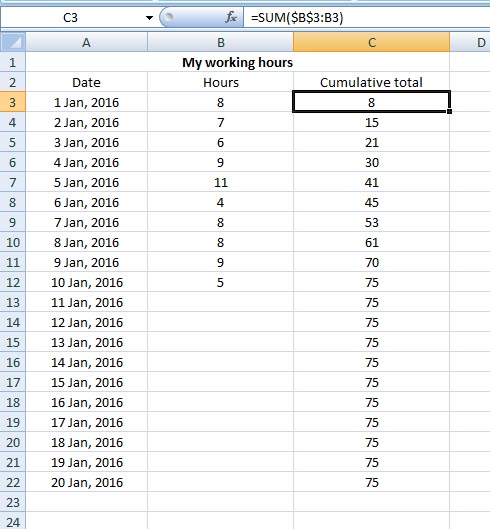
So you are calculating the cumulative sum of your working hours in Column C. So enter in C3 the following formula:
=SUM($B$3:B3)
Now copy this formula down the column C till 20th January.
Now let's come and break the formula:
Here you have made two references – first reference is absolute reference ($B$3) for which you used the $ sign and the second one is relative reference (B3), here you have no $ sign.
Absolute reference ($B$3) means, the value or number in cell B3 is fixed or locked, and will never change regardless of wherever you use it. But the relative reference will change as you continue copying it down the Column C.
So your cumulative sum formula
in C3 is =SUM($B$3:B3)
in C4 is =SUM($B$3:B4)
in C5 is =SUM($B$3:B5)
in C6 is =SUM($B$3:B6)...... and so on
However, as you notice, from cell C13 Excel has copied the last cumulative total from C12 all the way down the Column C although you don't have any entry in cells B13 to B22.
So to fix it, you will need to modify the above formula using the IF function. In cell C3 enter the following formula instead of the earlier one:
=IF(B3="";"";SUM($B$3:B3))
Copy the formula down the Column till C22.
This formula says, if cell B3 is blank, then leave cell C3 blank as well, otherwise apply the cumulative total formula in cell C3.
Note: there is no space between the double quotation marks (""; )
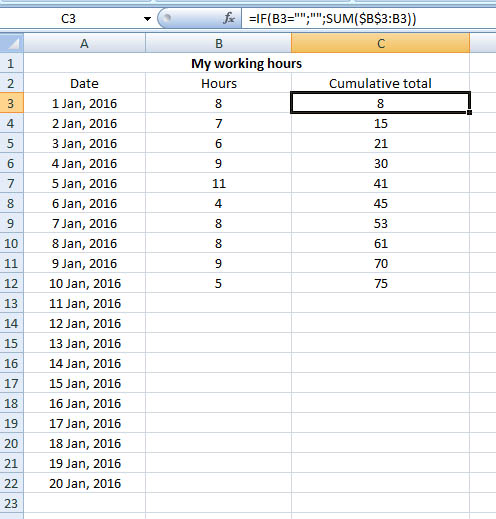
Look, this time from C13 to C22 cells are empty and not filled with the last total 75 as in the above case. But when there will be a new entry in cell B13 downwards, you will have your cumulative total in the corresponding cells in Column C.
Make your cumulative graph
Once you are ready with your calculation, you can make your cumulative graph. It's also very easy. May be you will need some trial-and-error drama here
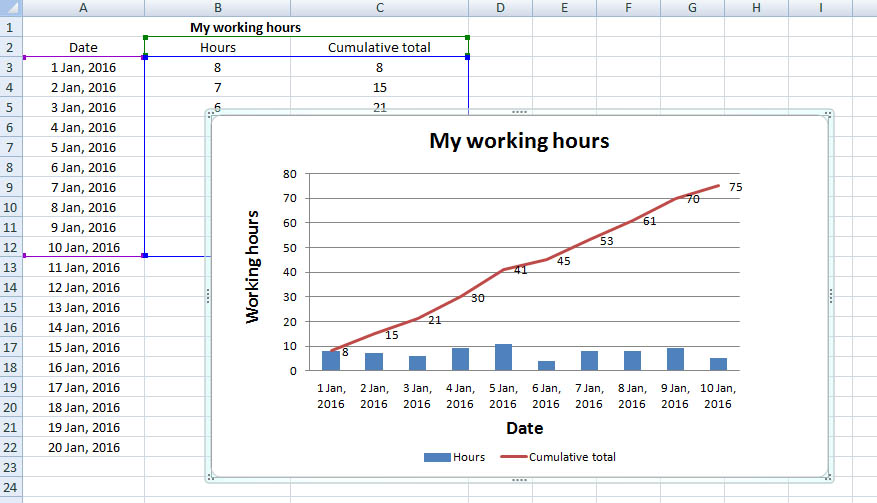
Select your data set (date, hours and cumulative total) > go to Insert > from Charts select the first icon from 2-D Column.
In your chart, right click on Cumulative total bar > click on Change Series Chart Type... > From Line options click on the first icon > click OK. Your Cumulative total bars have changed to line as in the image above.
Now click anywhere on your chart. You are now under Design tab. Here from Chart Layouts option, select the chart layout that shows you all the title options like – Chart Title, Axis Title for both axes (In Excel 2007, I have the Layout 9). Now edit the titles for your chart and for the axes.
Click anywhere on the Cumulative total line > right mouse click > click on Add Data Labels. Now you have the hours on your Cumulative total line.
I guess your cumulative graph is ready by now
*Recommended:
Read wonderful articles (English & German) on Science & Tech, Environment, Health and many other topics only on BlogArena.
For comments of suggestions, please contact us: info@shamskm.com