
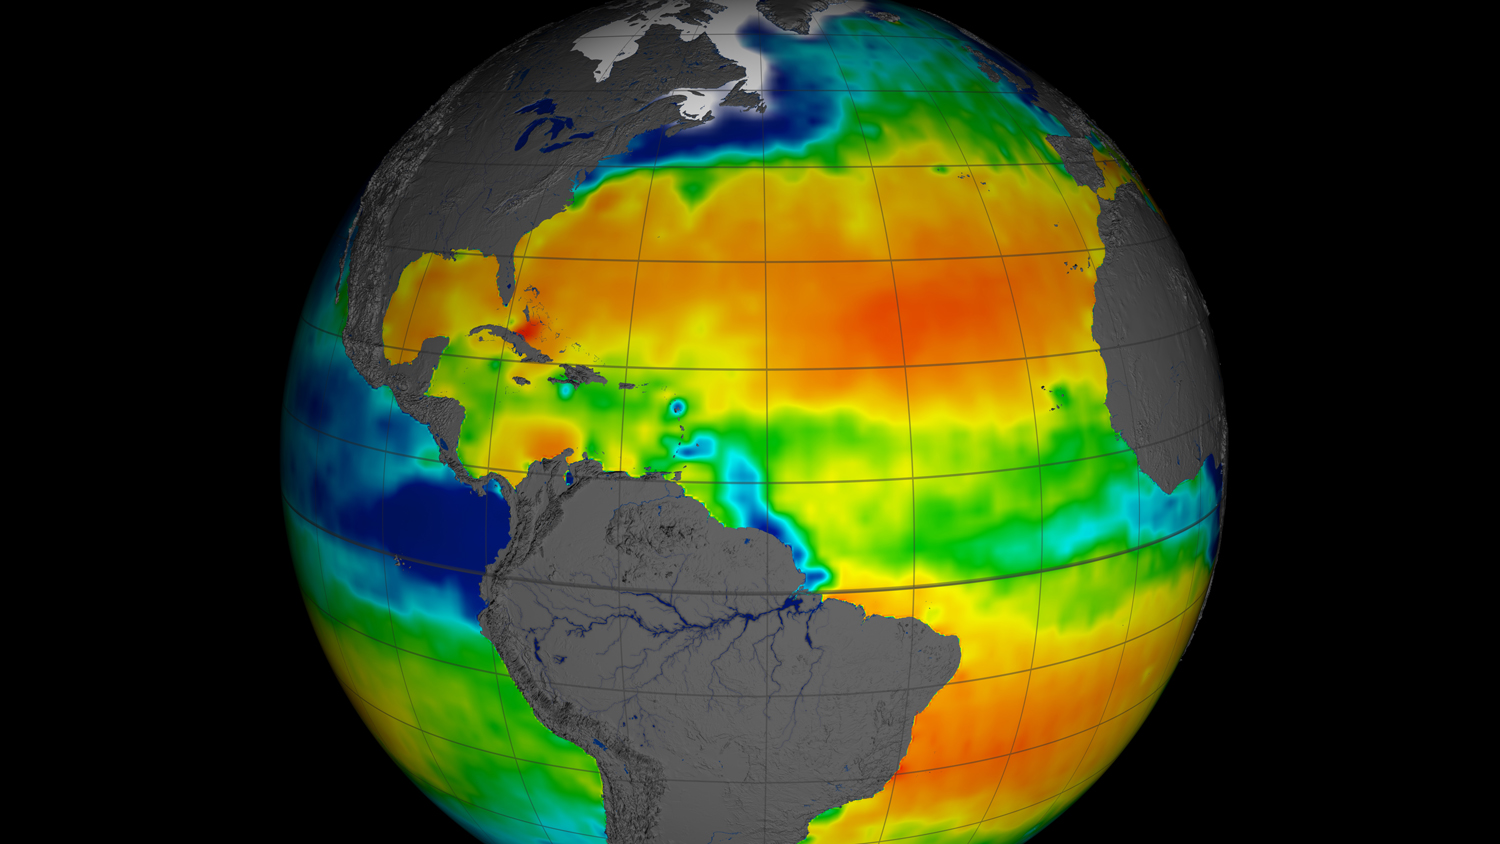
NASA has released the first full year of validated ocean surface salinity data from the agency’s Aquarius instrument aboard the Aquarius/SAC-D spacecraft. The data cover the period from Dec. 2011 through Dec. 2012. Red colors represent areas of high salinity, while blue shades represent areas of low salinity. Among the prominent salinity features visible in this view are the large area of highly saline water across the North Atlantic. This area, the saltiest anywhere in the open ocean, is analogous to deserts on land, where little rainfall and much evaporation occur. Aquarius is a focused effort to measure ocean surface salinity and will provide the global view of salinity variability needed for climate studies. The mission is a collaboration between NASA and the Space Agency of Argentina (Comisión Nacional de Actividades Espaciales). Image credit: NASA/GSFC/JPL-Caltech (Click image to enlarge)