
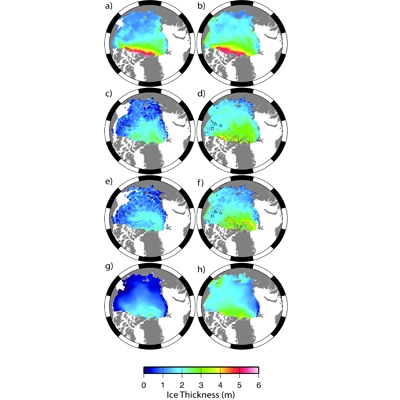
CryoSat sea ice thickness compared with PIOMAS and ICESat ice thickness measurements. The data are restricted to the “ICESat” domain covering the central Arctic Ocean. (a) shows the 2003-7 average ICESat ice thickness for October/November and (b) 2004-8 average for February/March. (c) and (d) CryoSat thickness for October/November 2010 and February/March 2011 and locations of the airborne EM data (black lines) and OIB data (grey lines) used for validation, ULS moorings. (e) and (f) CryoSat thickness for October/November 2011 and February/March 2012 and locations of the airborne EM data (black lines) and OIB data (grey lines) used for validation. (g) PIOMAS for October/November 2011 and (h) February/March 2012. Image credit: University College London